| What is DEMO-EMol? |
-
DEMO-EMol is a hierarchical method for assembling protein-nucleic acid complex structures from cryo-EM density maps.
It is an extended protocol of DEMO-EM,
which specially designed for constructing high-resolution structures for proteins containing multiple domains.
DEMO-EMol incorporates all the new features of the current version of DEMO-EM,
and further extends its capabilities to modeling protein-nucleic acid complexes
through integrating deep learning-based map segmentation with chain assembly.
| How does DEMO-EMol generate protein-nucleic acid complex structures from cryo-EM maps? |
-
Starting from the cryo-EM density map and its corresponding chain structures,
the protein and nucleic acid regions are segmented from the input map (salmon) using a U-net convolutional neural network,
generating a protein map (gray) and an nucleic acid map (cyan).
In the second step, each chain model is independently fitted to its corresponding map (protein or nucleic acid) using a quasi-Newton search. For protein chains, the model is further divided into multiple domains, which are iteratively fitted into the map. Once all domains of the chain are fitted, an optimization is performed to simultaneously refine the poses (translation and rotation parameters) of all domains. To enhance fitting accuracy and reduce search space, the map region matched by a chain is removed from the density map. For each chain, the top five poses are selected according to the correlation coefficient score between the model and the map.
In the third step, the complex model is constructed by identifying the optimal combination of all chain poses guided by a comprehensive energy function.
Finally, the complex model undergoes further refinement through a global optimization to generate the final complex model.
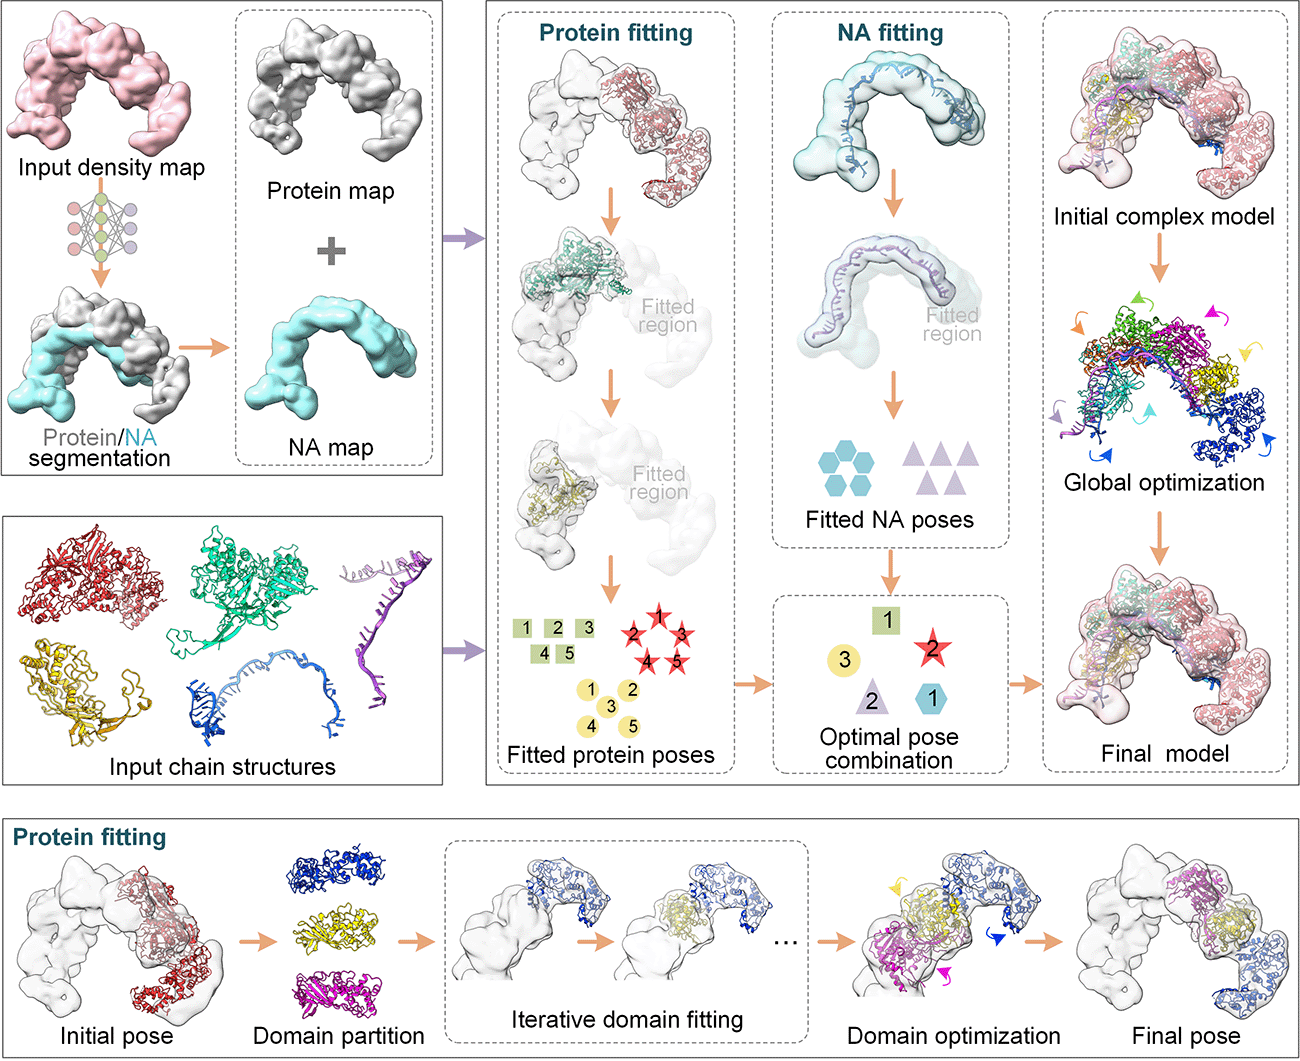
Figure 1. Pipeline of DEMO-EMol for automated construct protein-nucleic acid complex structures from cryo-EM density maps.
| What are the performances of DEMO-EMol server compared with other methods? |
-
We evaluated DEMO-EMol on a comprehensive benchmark set
comprising 97 nonredundant density maps collected from EMDB. This
dataset includes 49 protein-nucleic acid (NA) complexes and 48 protein-protein complexes.
For protein-NA complexes, DEMO-EMol was compared with two state-of-the-art protein-NA complex modeling methods: DiffModeler and Phenix. Figures 2A and 2B show the TM-scores of models constructed by different methods, where DEMO-EMol achieves an average TM-score of 0.92, which is 10.8% and 21.1% higher than those by DiffModeler (0.83) and Phenix (0.76), respectively.
For protein-protein complexes, in addition to DiffModeler and Phenix, we also compared DEMO-EMol with EMBuild, a dedicated protein structure modeling method. Figures 2C and 2D show that DEMO-EMol consistently outperforms other methods. Specifically, DEMO-EMol achieves an average TM-score of 0.91, which is 8.3%, 13.8%, and 30.0% higher than those by EMBuild (0.84), DiffModeler (0.80), and Phenix (0.70), respectively.
Theses results demonstrate DEMO-EMol's ability to construct accurate models for both protein-NA complexes and protein-protein complexes.
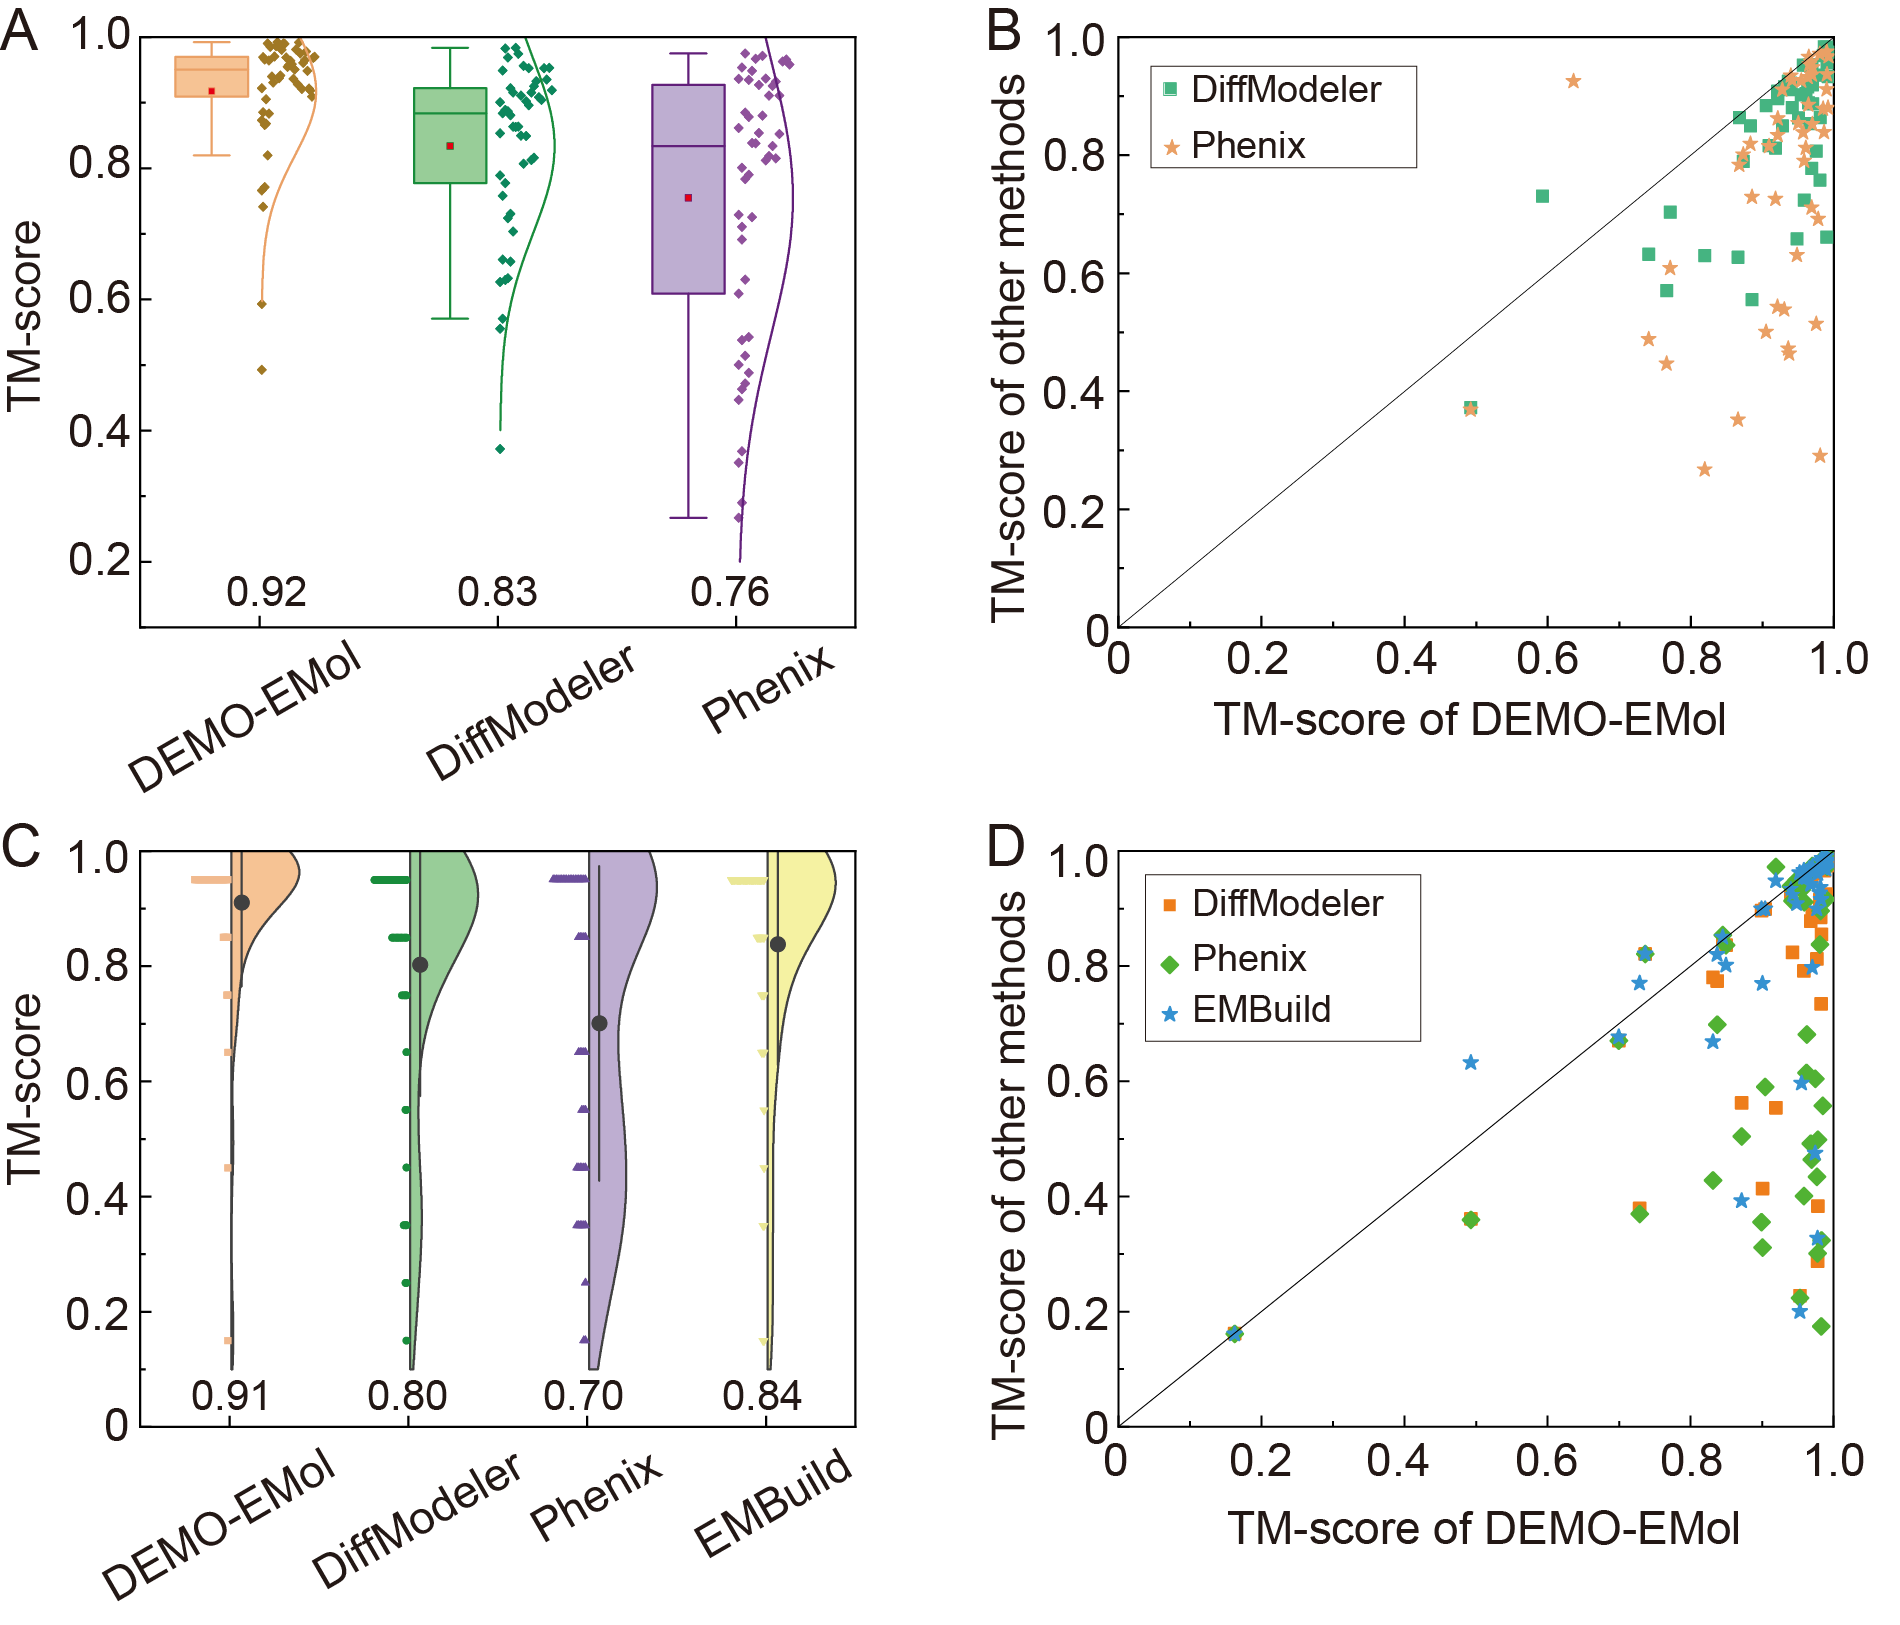
Figure 2. (A) Boxplot and distribution of TM-scores for models generated by different methods on the dataset of 49 protein-NA complexes. (B) Scatter plots comparing TM-scores between DEMO-EMol and other methods for the protein-NA complexes. (C) Boxplot and distribution of TM-scores for models generated by different methods on the dataset of 48 protein-protein complexes, respectively. (D)Scatter plots comparing TM-scores between DEMO-EMol and other methods for the protein-protein complexes.
| How to run the example on the DEMO-EMol server? |
-
To run the given example on the server, please follow these steps (Figure 3):
- Click "Example Input" (Lable 1) to download a compressed file named "example.zip"
- Uncompressed the downloaded file to obtain a new file contains "chains.zip", "map.mrc", and "resolution.txt".
- Click the "Choose File" button (Lable 3) to upload "chains.zip", which contains all chain models for assembly.
- Click the "Choose Fule" button (Lable 5) to upload the cryo-EM density map named "map.mrc".
- Enter the map resolution (3.7) in the text box shown in Lable 6.
- Click the "Run DEMO-EMol" button (Lable 7) to submit the job.
Once the job is successfully submitted, the browser will direct to a new page (example) containing the job id, the submitted input file, and an estimated runtime. The results page will refresh automatically upon job completion, showing all generated outputs. We recommend bookmarking this results page for convenient future access.
The server will display notifications if the uploaded files are incorrect or if any rquired files are missing.
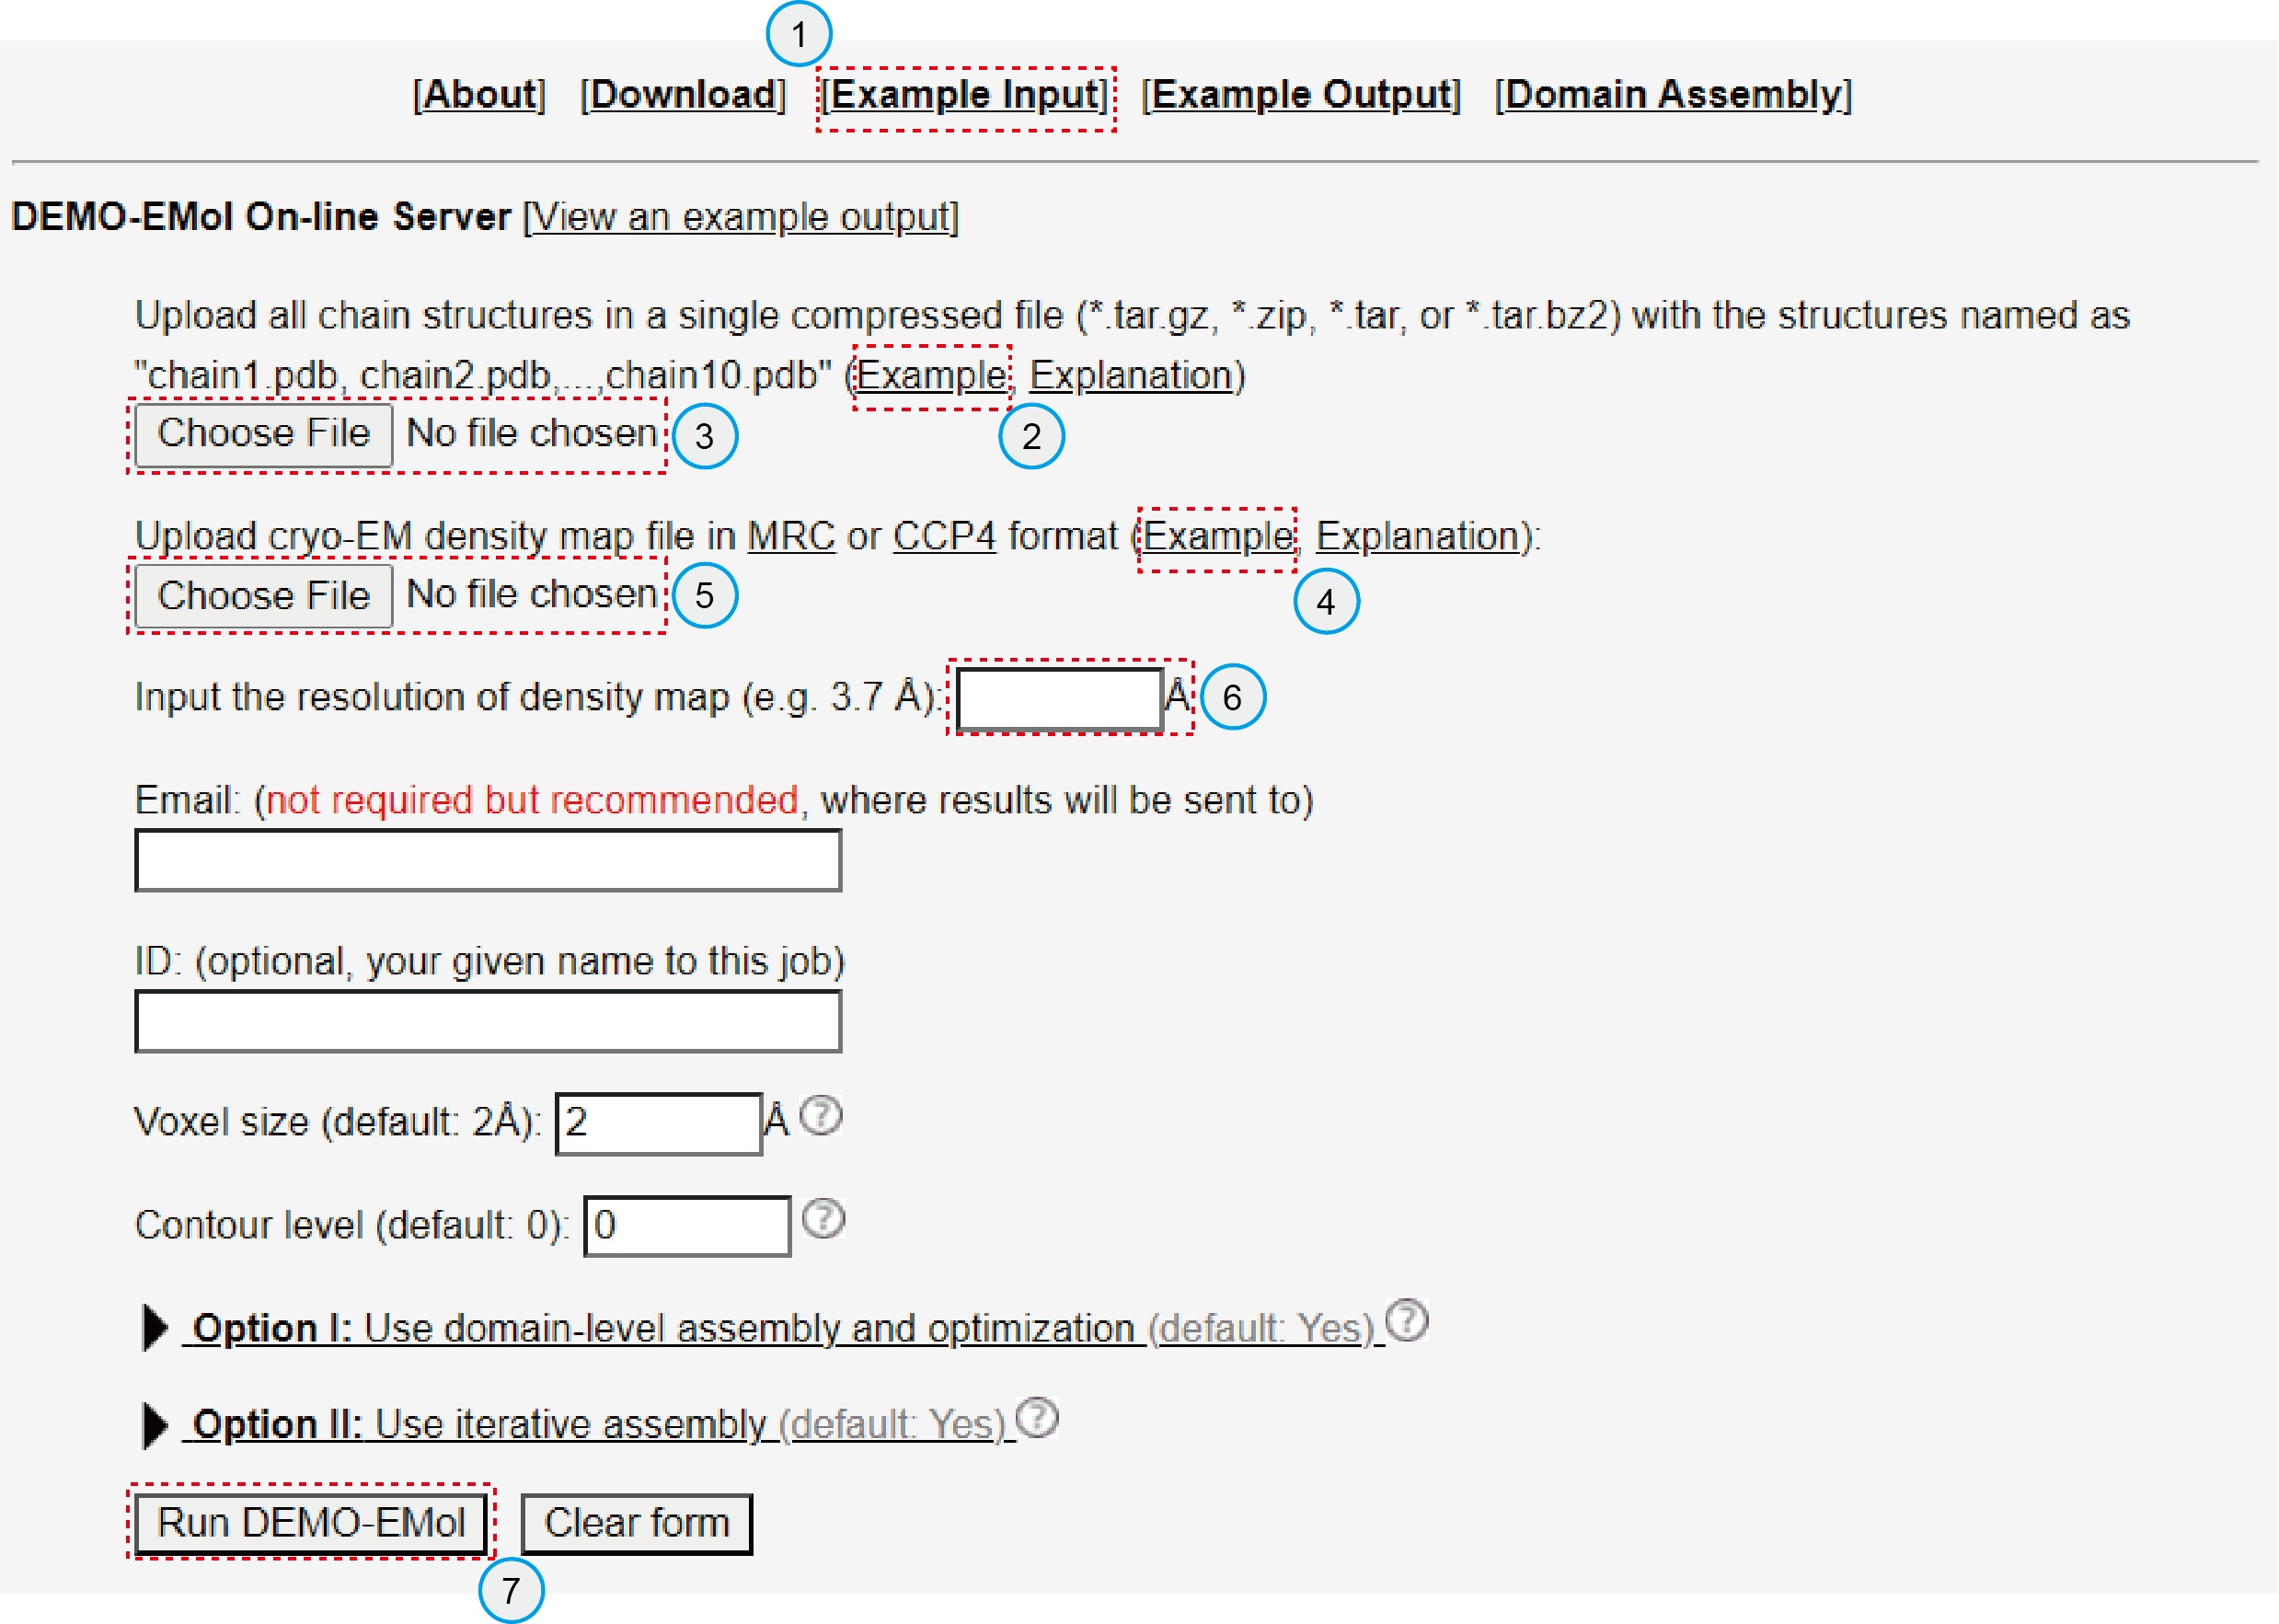
Figure 3. Server Input Interface.
| What's the output of the DEMO-EMol server if you submit a job? |
-
The output of the DEMO-EMol server include:
- Visualization of single-chain model
- Visualization of final complex model shown in the map
- The correlation coefficient score (CC-score) and the Fourier shell correlation score (FSC-score) between the full-length or chain model and the density map.
- Molprobity-score for chain and complex models
- Scatter plot of the per-residue CC-score of the constructed model
- Downloadable results file information (The generated models do not include non-standard residues or unknown residues.)
| Under what circumstances may DEMO-EMol fail to generate accurate models? |
- Although DEMO-EMol can correctly adjust the orientation of initial domain structures,
the final modeling accuracy may be compromised if the initial domain or nucleic acid structures are of low quality.
We recommend that users evaluate the quality of input chains using model quality assessment methods such as
DeepUMQA-X and similar tools,
and select high-quality chain structures for submission to ensure better modeling results.
- The quality of the density map affects the modeling accuracy of DEMO-EMol.
We recommend using maps with a resolution better than 10 Å whenever possible.
If higher-resolution maps are unavailable, users may enhance lower-resolution maps with tools
such as EMready and similar tools before submission to improve performance.
| How to interpret the output data generated by the DEMO-EMol server? |
-
The outputs of the DEMO-EMol modeling results are generally summarized in a webpage,
the link of which is sent to the users by email after the modeling is completed.
If the user does not provide an email address,
they can simply wait on the submission page,
which will automatically refresh until the task is completed and the results are displayed.
In the following, we present answers to several
most frequently asked questions in interpreting the DEMO-EMol results.
- What is CC-score?
CC-score is the correlation and coefficient score between the experimental density and the density probed from a model.
- What is FSC-score?
FSC-score measures the normalised cross-correlation coefficient between the experimental volumes and the volumes probed from a model over corresponding shells in Fourier space.
- What is Molprobity-score?
The MolProbity score is a quantitative metric that combines various geometric and stereochemical validation parameters into a single value. It assesses how well a structure conforms to expected molecular geometry and helps identify potential errors in structural models, with lower scores indicating higher structural quality.
| How long does it take for DEMO-EMol to generate the structure? |
-
It usually takes several hours to 1~2 days from submitting a cryo-EM map and structures to receiving
the modeling results. But if too many chain structures and excessively large cryo-EM map accumulate in the queue,
the procedure may take a longer time. The time also depends on the protein
size and a smaller protein takes shorter time than a larger protein.
| How to cite DEMO-EMol? |
-
You are requested to cite following article when you use the DEMO-EMol server:
- Xiaogen Zhou, Yang Li, Chengxin Zhang, Wei Zheng, Guijun Zhang, Yang Zhang. Progressive assembly of multi-domain protein structures from cryo-EM density maps. Nature Computational Science, 2: 265-275 (2022).
| Funding support |
-
The development of DEMO-EMol server is supported by the National Institute of General Medical Sciences(GM136422 and S10OD026825),
the National Institute of Allergy and Infectious Diseases (AI134678),
the National Science Foundation (IIS1901191 and DBI2030790).
This work used the Extreme Science and Engineering Discovery Environment (XSEDE),
which is supported by the National Science Foundation (ACI1548562).
| Contact information |
-
The DEMO-EMol server is in active development with the goal to
provide the most accurate complex and large size structure modeling.
Please help us achieve the goal by sending your questions, feedback, and comments to
zhouBiolab@163.com.